Mind Mapping for Project Planning and Management

Creativity, patience and organizational ability are all important talents for project managers, but detailed documentation is a critical success factor which should addressed first of all, and mind mapping is a great way to manage project documentation. Because mind maps create visual and easy-to-understand-and-follow documents, many professionals regard this tool as ideal for project planning and management. Priorities, tasks, dependencies, milestones, resources, durations, lead times and more can be visualized and presented to the team with help of mind mapping software. And you don’t have to be well experienced in idea visualization and presentation – everything you need is to use your creativity and have right understanding of subject matter to stimulate your mind and create a project map, either Gantt chart, WBS hierarchy, Team organizational chart, or whatever else document.
What is Mind Mapping?
People have been using their mind maps for their projects for more than 40 years. Tony Buzan, a renowned UK consultant and researcher, has presented the concept of mind-mapping in his book ‘Use Your Head’ in 1972. Initially, the concept was mainly to facilitate notes taking and idea capturing. Since that time the concept has been improved and popularized among businesses, and today many business managers love to create visual maps for planning projects and formulating their ideas
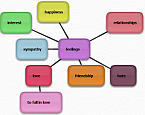
Mind Mapping (sometimes referred to as visual mapping or idea mapping) is a data visualization technique to graphically establish connections between several ideas or pieces of information. This technique involves writing down each idea and then linking this idea to other related pieces by lines or curves, thus creating a web of relationships. By analyzing and shifting these relationships, the researcher then can figure out how to best plan the course of action and what outcomes should be expected.
 The technique allows for the collection, structuring and visual presentation of a great deal of information to simplify decision making and explore the best solutions for a particular problem. By using mind maps an individual can capture, classify, analyze and visualize complex ideas and concepts. For example, a market researcher can visualize the process of generating prospective clients by creating a sales funnel mind map that represents how the leads would move through the sales pipeline, what factors would impact lead generation, and what solutions would increase conversion rate and ensure growing revenues.
Using Mind Maps for Project Planning
The key idea behind using mind maps for project planning is that a planner can focus attention of the rest team on the predecessor-successor relationships between project tasks, so that the team will understand which task comes first, what priority sequence to follow, how to allocate scarce resources, and what results to deliver. The technique allows capturing best practices and framing knowledge to facilitate project planning and management. The planner can use his mind map to show the project manager a better way of project development, while the manager can use the mind mapping technique in identifying and solving problems, brainstorming the team, and also developing an alternative plan of work (against the approved project plan).
Mapping out a WBS
Guesses, quotes, estimations, recommendations, guidelines, and other ideas in planning can be captured and presented visually. Team members and leaders can participate in the mind mapping process to facilitate the planner and also make notes and records on every detail that is essential for project planning. In particular, the mind “mapper” can represent the levels, dependencies and nodes in a hierarchical Work Breakdown Structure (WBS) to instantaneously and persuasively explain the team in what smaller components (phases, deliverables and work packages) the entire work will be decomposed and what size, duration, and responsibility will be set for each component. The project manager can use this mind plan in designing the framework of project planning and management, in particular to state the constraints of schedule, cost, time and quality.

Visualizing Gantt Chart
Using Gantt chart views is a time-proven job scheduling practice. A Gantt chart shows start and finish time of project tasks, critical path and non-critical activities, float time, and also dependency relationships. One more benefit you can derive by using mind mapping for project planning and management is Gantt chart visualization. By creating a mind map for your project schedule, it becomes possible for you to map out a work timeline template with milestones, dependencies, tasks, due dates, lags, resources, priorities, critical paths, and more items. You can brainstorm your visualization plan with the team to identify weak places and remove inefficiencies.
For example, using MindGenius app you can build a Gantt chart and share it among your team members. The chat can be switched over to a full view so the team will see all the details of your mind map from one screen. Another example is MindManager (it is often regarded as a cut-down version of MS Project) which supports integration with MS Project.
Project Management via Mind Mapping Software
Traditionally, a sheet of paper and a pen are used to as the key tools to draw and visualize something. Tony Buzan in his book ‘Use Your Head’ suggested use larger paper sheets and color pencils to create the most informative and intelligible mind maps. With the development of computer technology and software solutions, today many project managers prefer mind mapping software to the traditional tools. Such software is multi-functional, user-friendly, and allows creating project management mind maps and pictures with a few mouse clicks. Users can easily publish and share their “drawings” among others with ease. For example, Mindjet lets share maps by using email or by publishing a link to the map on a website or intranet resource.
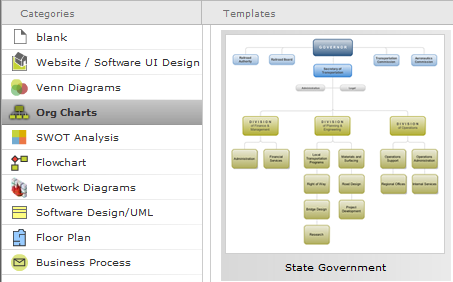
I personally prefer using Gliffy.com, an online diagram software app. Although originally this web solution is not specifically designed for mind mapping for project planning and management, still it remains among my favorite programs. I use Gliffy templates to build org charts, carry out SWOT analysis, and make network diagrams as well. It is easy, feature-rich and online – that’s why I prefer it. Besides, it is free for use (only limited functionality – you cannot save and export your maps; registration is not required).

Gliffy.com diagram software
Status Reporting and Task Tracking Made Easier
The current status of a project represents a set of circumstances that impact the project, define work progress state, and provide valued information for further analysis and decision making. Task tracking enables a better understanding of why one or another task is done, when other tasks will be done, whether there is a need for additional resources, and which of the scheduled milestones are passed over.
Having mind mapping software in place you can break down complex status reports and task tracking summaries into smaller linked maps which can be filtered, sorted out and grouped. Many solutions provide built-in templates and sample project management mind maps that save time and effort. For example, in MindView app you can use templates to visualize work in progress and report on performance. Besides, this program supports Microsoft Word integration, so you can easily import and export your minds maps for improving your project management processes.
Some Suggestions for Making Project Maps Better
Below read some suggestions that can help you define and manage your project maps and documents with help of mind mapping software.
- Create an idea file and update it with new thoughts or correct the existing ones throughout the entire project lifecycle
- Use mind maps to review, refine and improve project objectives and goals
- Plan and keep track of milestones, task dependencies, activity durations and critical path in Gantt chart visualization
- Visualize and brainstorm a list of questions about work in progress for each lifecycle stage and always look for best solutions
- Design a visual representation of stakeholder relationships to make it clear for the team and senior stakeholders how information requirements should be handled and exchanged
- Mindmap the organizational team structure with the details on team roles, responsibility and authority
- Add notes and records to provide your project map with additional information


