 Critical path in project management is one of the most popular methods to plan and control work. It helps project managers to figure out the most important or critical tasks of their projects, consider dependency in between those tasks, and also measure the impact on other non-critical activities.
The method defines how long it will take to complete a project and what key activities will compose the scope of work… Let’s learn more about this technique, explore the definition of CP, and view example use of network diagram in MS Excel spreadsheet.
What is a Critical Path in Projects?
CPM was developed as a formal project scheduling technique in the United States in the early 1950s. The key focus was placed on managing project finance through reducing task completion times. The method was first applied at industry level to model product development, engineering, construction, aerospace, and other project environments. It was implemented at lower levels (company, department, team) later on.
Since that time, critical path in project management has been modified many time and new definitions and categories have been added. So, today the original definition of critical patch is no more in use, however the fundamentals remain current.
Critical Path Defined
Critical Path (CP) is defined as the longest estimated sequence of interdependent activities that should be accomplished on time to ensure completion of the project on due-date. The critical path activities are performed under the “predecessor-successor” relationship, so that any next activity cannot be started until its predecessor is complete.
As implied by this definition, CP represents the most important tasks or events that are organized into a dependency sequence and that directly impact the project’s completion date. These tasks/events determine the longest duration for the entire work and are helpful in activity scheduling and resource allocation.
Flexibility Time and Float
CP is the way to minimize risk of failure and understand where the project manager has and doesn’t have flexibility in decision making.
In this context, a flexible decision means that there are some tasks that can be started earlier or later without jeopardizing the completion date, so that the manager can manipulate and adjust the project schedule taking into account the time period between the earliest start date and the latest end date of each activity. That time period is rarely called “flexibility time” and rather frequently called “float” or “slack“. By definition, an activity that has float time will not be included in the critical path.
Float is the amount of time for which an activity can be deployed without delaying the completion date of subsequent tasks (successors) or the entire project.
Critical Path Method Definition
Critical Path Method (CPM) defines a scheduling technique intended to predict work duration by using network analysis. The CPM is a set of practices and techniques used rather in complex projects to identify and sequence the activities (critical path) that have the highest impact on the project’s due-date, to schedule time required for their completion, and to establish the predecessor-successor relationship between the activities.
The method of critical path in project management involves use of network diagrams to make it easier for decision makers to see how long each activity will take. CPM is essential in predicting work timeline, and through using the method in combination with activity network diagrams the project manager is enabled to:
- Schedule the estimated time (duration) each task or event will consume
- Combine all activities’ durations into a timescale for analysis
- Figure out how each activity impact the progress of the project plan
- Make right team assignments regarding the critical tasks
Activity Network Diagram to Visualize the Critical Path
As said above, one of the best ways to ensure effective project planning and scheduling is to use activity network diagram. Such a diagram makes is easier for planners to visualize possible activity paths and define the critical one.
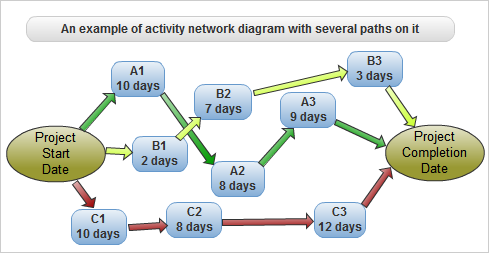
Teams use network diagrams to get a visual of the entire work broken down into interdependent tasks and to plan their further actions accordingly. Bubbles, boxes and arrows will help understand the activities and how they are link to each other. The project manager produces the diagram to model the activities flow and visualize the critical path definition. Each activity is marked either with a certain code (ID) or name; activity paths need to be highlighted. Below is an example.

This activity network diagram shows three possible paths to do the project from start till completion. The green, yellow and red arrows indicate how the activities need to be sequenced in each respective path
Example: MS Excel Spreadsheet for CP Method
In your work breakdown structure, you have a complete list of all activities to be carried out within your defined project, from start to finish. Your goal is to analyze the duration and predecessor(s) of each activity and then to try to draw a network diagram. Activities that have zero float time and must be completed on time can be added to your critical sequence.
Critical path in project management can be analyzed and visualized with help of spreadsheet software. For example, you can use MS Excel to create a spreadsheet with all of your project tasks in it, including their ID, Duration, Predecessors, and Successors. Alternatively, you can use MS Project that offers greater functionality for defining and analyzing critical paths in projects.

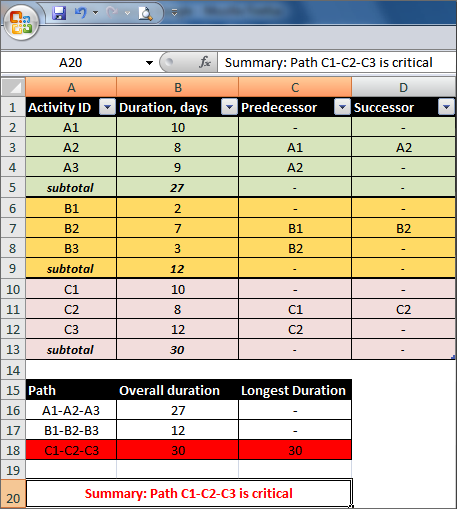
MS Excel lets you create a spreadsheet for analyzing activity sequences by duration to define the critical path which has the longest duration
In this critical path Excel spreadsheet, we have three possible sequences that carry out the project from start to completion. As a project manager, first you need to calculate the overall duration of each sequence and then compare the durations against each other. The activities that define the longest overall duration will compose the critical path (in our example, it is path “C1-C2-C3” with duration “30 days”).
Your next step in analyzing critical path method is to create Gantt Chart to visualizes CP on calendar. Gantt Chart will help you design a project schedule and agree on activity durations and float time. Both MS Project and MS Excel can help you with designing Gantt Chart.
Common Questions and Answers about Critical Path
- What type of chart typically displays the critical path?
A critical path is often represented on a Gantt Chart. It starts at the start of activity 1 and extends to the end of activity n. Network diagrams help show interdependent activities - Can there be more than one critical path?
There can only be one critical path in a project schedule — the series of activities with no float time, extending from start to finish. - How do you decide on the critical path?
Once you know your project’s activity list and their durations, you can visualize them in a network diagram. By looking at the diagram, you’ll see which activities are on the critical path and which ones aren’t needed (they’re off the critical path). This will help you plan your project better and get a better handle of its progress. - Can critical path have float?
Once you’ve identified the longest duration for each activity, if its float time is under a week, it can be removed from the critical path and added to your extended float time. - Can critical path analysis be used for any type of project?
The CP method can be used for any project where there are multiple tasks that need to be completed in a certain time frame. It can be used for projects in IT, engineering, construction, marketing and operations.


